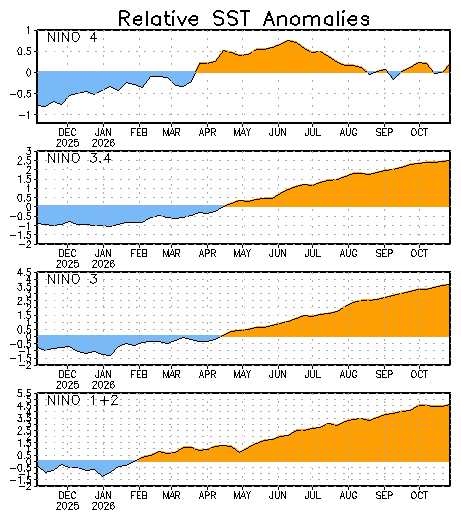
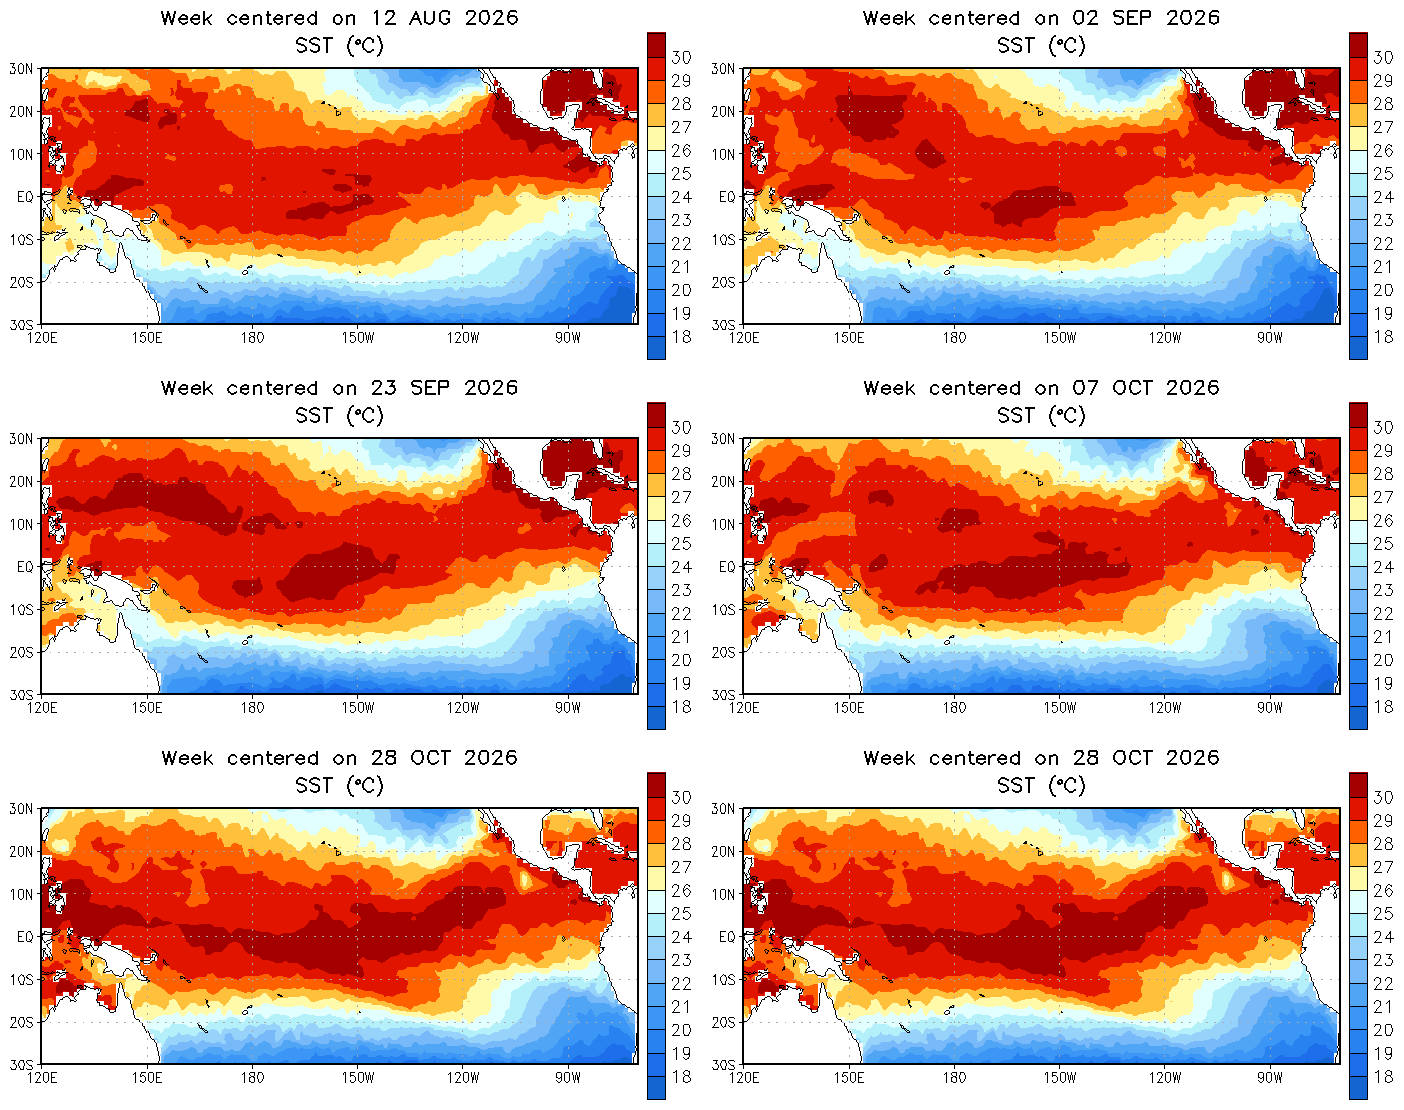
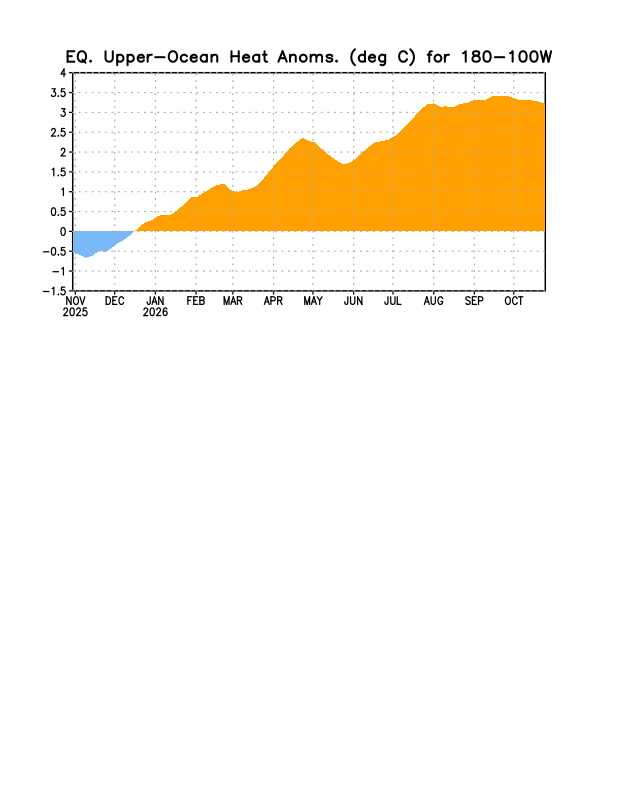
Sea surface temperature anomaly (last week). Red = warmer than normal, blue = cooler. — NOAA CPCLast weeks, animated. Watch how the warm water spreads across the Pacific. — NOAA CPCSubsurface heat content. Upper-ocean heat anomaly (0–300 m) along the equator; it often anticipates surface changes. — NOAA CPC
We use advertising (Google AdSense) and analytics cookies to keep this site free. You can accept or reject them. Learn more